

Netback,well by well
A netback calculator and Power BI dashboards for Aspenleaf Energy: a case study.
For about three and a half years we were Aspenleaf Energy's main analytics partner. The centrepiece: a netback calculator that turned a one-person Excel tool into a Power BI dashboard where users test oil-price scenarios and switch wells on and off to see revenue and netback change instantly.
Aspenleaf EnergyClient
Dec 2022 – May 2026Period
Main analytics partnerRole
Python · Power BITools
Engagement
Lead analytics consultant and trusted advisor to Aspenleaf's technical and business teams for about three and a half years, as the company's main analytics partner.
What we built
- Netback Calculator (Python/Jupyter + Power BI). The starting point was an Excel tool that held the basic cost-splitting methodology, but only one person could run it, one scenario at a time, copying values by hand between sheets to compare results. We turned it into an integrated tool that draws directly on the source systems and allocates fixed and variable costs by well, pad and facility to calculate unit economics per barrel. In the resulting Power BI dashboard, users set oil-price scenarios and turn wells on or off to see instantly how revenue and netback change.
- Power BI dashboards for operational and commercial performance.
- Forecasting and predictive-modelling tools.
Key challenges
- Data integration: combining data spread across Oracle databases, vendor data in Snowflake, ProdView and Excel/CSV exports into a single, consistent model.
- From needs to sustainable processes: translating the needs of stakeholders across operations into sustainable processes, with tools that bring clarity and make it possible to track improvement over time.
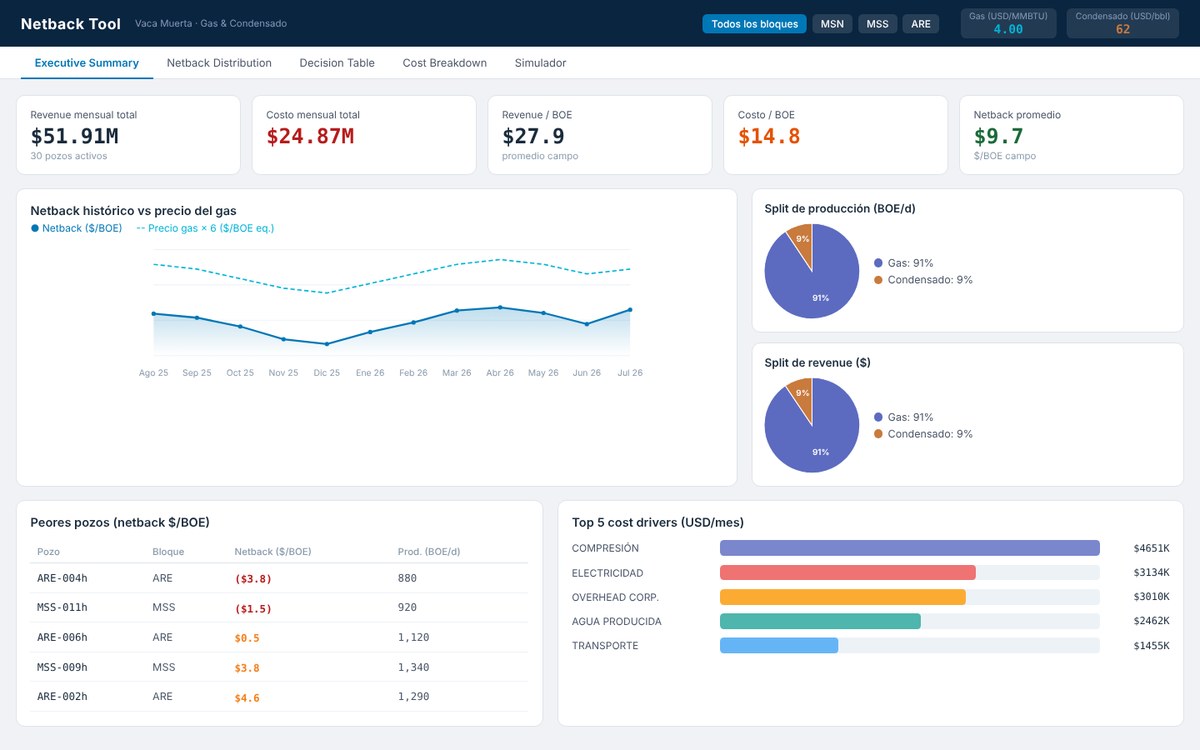
The same approach in an interactive mockup with fictional data (not the client's dashboard).
Facing a similar decision?
Tell us about your data and the decision it should support. The first call is free.