

FIFA 2026 World Cup was the longest and biggest World Cup ever in terms of number of participants. For the first time in history, the teams that made it to the end had to play 8 games rather than 7. Including the pre-competition camps, which started a couple of weeks before the official kickoff, players and coaching teams spent a longer-than-ever time of maximum stress and concentration. For the 4 teams that made it to the 8 games, that time was more than 50 days.
Part of the longer duration was probably meant to allow more rest time between games, however the longer stays in the “work camp” weigh on worker’s minds.
During 2022 World Cup, Post Match Summary Reports (PMSR’s) caught my attention so the idea came to mind to use them to compare the 2 World Cups, considering they cover every game in the 2 competitions with very little change. As a Data Scientist, I am interested in using the data in these reports to prove (or disprove) theories and observations I made during the games. We could frame this in the opposite direction: let the data tell us differences and similarities between the tournaments. Traditionally, scientists plan experiments where some variables are controlled and others allowed to move freely and measured, to provide the answer about their nature. In football, on the other hand, all variables are freely moving, and we try to measure as many of them as we can at any given time. Our job here is to frame questions in such a way that the available data can answer them as clearly as possible. In the end, that is always the job of a scientist: to translate the world we see into variables that can be measured to derive an “objective” knowledge of the world rather than just relying on opinions. That is the challenge in today’s football (and sports in general) and that is what I am passionate about. There isn’t a single narrative that can be derived from the data, but rather as many narratives as you can come up with as long as they don’t contradict the data. This means that the fact that I come up with an explanation that fits the data doesn’t make it automatically true. I should spend as much or more time trying other possibilities that also fit the data but lead to different decisions. Here are some examples:
2022 to 2026 data comparison
To compare data between these two World Cups, we first need to account for the difference in format of the tournaments. 2026 had more games than 2022, there was one more elimination game in 2026, there were more teams participating and they were played during different parts of the year and of the season. We are forced, then, to make some normalization to compare apples to apples. For example, I can’t compare amount of goals, I have to compare goals per game (goal/game) or even goals per 90’ (goal/90’) given that some games last 120’ rather than 90 due to extra time. This considered, there were 2.88 goals/90’ in 2026 compared to 2.62 in 2022. Clearly more goals, right? Well, not yet. To say that something changed and more goals are being scored, we need the difference to be statistically significant (not just due to randomness). For example, would it be enough with a difference like 2.62 to 2.63 to say that something has changed? Well, that seems like a very “small” difference. The question then becomes: when is a difference big enough to be considered significant? There are specific statistical tests to answer this type of question (see Appendix for details) and in this case Poisson and negative binomial regression say that the difference is not significant. We could also argue that if we are trying to understand game evolution, the inclusion of new (and weaker) teams could be affecting our comparison. To isolate these effects, we could compare goals scored only by the 26 teams that were present in both World Cups. And if we want to account for rival quality, we can also adjust for the strength of each team and its opponent using the FIFA ranking.
The graph below shows the comparison between 2022 and 2026 using these 3 methods: raw data comparison, correction by rival strength and only national teams in both tournaments. Each group has a band around it (line to both sides of the data point) which represents the “natural randomness”. Whenever the lines intersect the 0 axis, the change was not statistically significant. I’ve kept all details and calculations in the appendix to make reading easier.
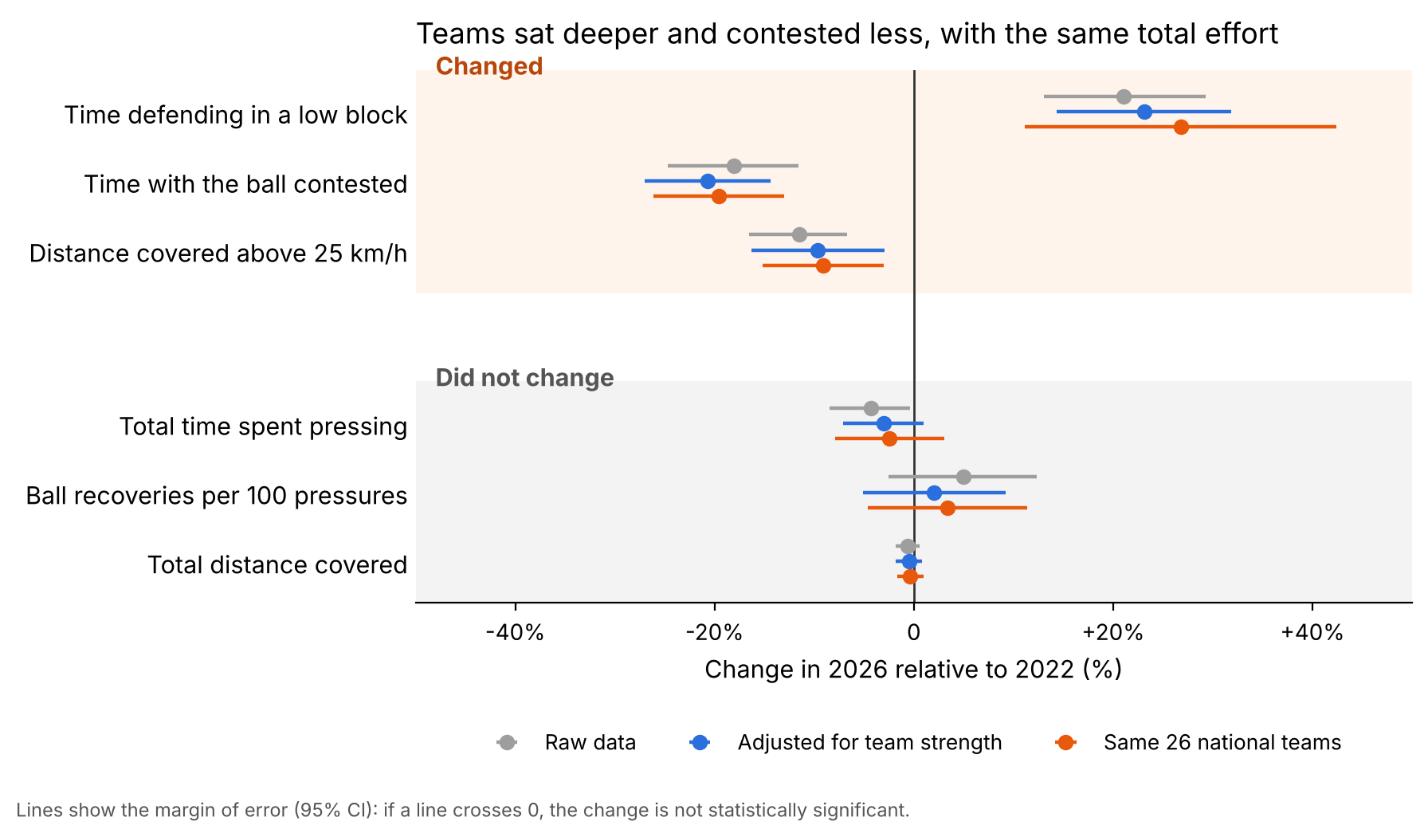
Among the differences to point out, one particularly caught my attention because I remember observing it when watching the games live: teams spent more time on average defending in low block. “Low block” as a fraction of total time out of possession, grew by 27%. The low block was also shorter by 3 m due to forwards coming deeper down, rather than defenders pushing up. Pressing also changed. Their count went down by 8% but their duration compensated by going up 6%. They also tended to push the rival towards the sides. The effectiveness wasn’t worse, recoveries per number of pressures remained constant. But with the increase in ball carries and build-up unopposed and the drop of counter-attacks and duels, it does look like upon ball loss, teams tended more to drop deep than to dispute possession through the whole pitch.
In the physical aspect, there has been a drop in high intensity compared with 2022 with the same total distance covered. What’s interesting is that there hasn’t been a drop in high intensity through the competition but just as a whole compared with 2022. There has also been an increase in the frequency of games in which 5 substitutions were made, specifically in the first phase (group stage and round of 32). This could not prevent, though, the concentration of minutes in the 11 most used players in each team.
Goals from outside the box
A bit of a fun fact: even though the sample is a bit small, the effectiveness of shots from outside the box doubled. Rounding up a bit for simplicity, a similar number of shots per 90’(just 12% difference) produced 1 goal per team every 5 games as opposed to every 10 games in 2022. Searching for likely causes, I looked into the locations the shots were taken from and the places where the shots landed in terms of proximity to the posts and cross bar. I found the average distance and angle of the shots hasn’t changed. Neither has the % of shots that landed within 50 cm of the posts and cross bar. I didn’t find a culprit in the shooters or goalkeepers either: there hasn’t been a concentration of successful shots in few especially good shooters or especially bad keepers. On the contrary, successful shots were spread across many shooters and goalies, some of them with great track records like Alisson or Courtois. The striking part is that the increase in effectiveness does not happen in the shots within 50 cm of the posts and cross bar, it happens in the rest. For this specific group of shots, 3 out 104 ended up in goal in 2022 compared to 22 out of 180 in 2026. These changes don’t apply to the shots within the box. The most likely explanation I found is the ball itself. Maybe the ball was harder to get for goalkeepers under certain conditions than that of 2022. During the group stage, Joe Hart, former England goalkeeper, said he’d seen that type of goal “too many times” for a World Cup: shots at the height of the shoulders, no spin, the goalie touches but fails to save. It reminds me of the discussions before South Africa 2010, in which the Jabulani was criticized in a similar way. Casillas called the Jabulani at that time “horrible” and Buffon called it “inadequate and shameful” for a World Cup. The difference is this time we can back that up with data: a test in the wind tunnel was published in July in Scientific Reports comparing the Trionda with Al Rihla from Qatar 2022. At 30 m/s and without spin (which is the condition of a shot from outside the box), lateral forces that move the ball are 36% more unstable for the Trionda. In short, the ball moves more while traveling in the air, which coincides with what FIFA reports reflect: goalies are as effective as before for shots within the box but their effectiveness drops in shots from outside from 46% to 34%.
Theory
2026 World Cup was longer and had more participants, but data does not suggest any tactical or physical change because of these differences. We do see changes compared with 2022 as mentioned before (changes in pressing, more low block and less high intensity), but these changes can be explained as a combination of hot weather, accumulated season tiredness and changes in style in the game (this could be corroborated with data from clubs’ football). The effect of heat can be quantified quite well statistically (see appendix). There doesn’t seem to be a conscious decision from coaching teams to change the style of play to accommodate the change in the format of the competition beyond the more frequent use of the 5 subs in the first phase.
The difference in strength due to the inclusion of lower ranked teams was only noticeable in the increase of games with 3 or more goal difference (10%-23%) but not in dominance during play.
The one parameter that could be related to tiredness is the increase in subs due to physical problems during the final stages (note this is speculative, given there is no official report on the reason for substitutions). An example of this was Argentina that had to substitute 3 out of 4 defenders during the final game due to physical problems (2 injuries and one reported discomfort).
Alternative theory
An alternative way of accounting for the same data is to think that the coaching staff did make a conscious decision to limit pressing intensity and to sit deeper from the very beginning of 2026 WC preparing for a longer competition with lower team quality on average. This could explain the parity in game domination despite bigger differences in team levels. The question that stems from this explanation is why didn’t teams go back to high pressing and high intensity runs in the final phases. Maybe because they couldn’t. Maybe the tiredness of the longer tournament showed up as an impossibility of increasing intensity rather than the drop of it. Maybe in the end, the coaching staff did do a great job at preparing the teams to sustain the effort until the end, by limiting it at the beginning.
This is what I mean by generating different narratives from the same data, even when the data is correctly interpreted technically. This is also why being a scientist has been always my passion, every field I worked in and every role I played. Because being a scientist is not about knowing it all, but about keeping the conversation open and correcting errors to keep improving.
Table 1. Metrics cited in the text
| Metric | 2022 | 2026 | Change | Statistically significant? |
|---|---|---|---|---|
| Tournament context | ||||
| National teams | 32 | 48 | +16 | — |
| Matches | 64 | 104 | +40 | — |
| Maximum matches per team | 7 | 8 | +1 | — |
| Days of rest between matches (mean) | 4.1 | 5.3 | +1.2 | — |
| Mean stadium temperature¹ | 22.2 °C | 23.6 °C | +1.4 °C | — |
| Goals | ||||
| Goals per 90 minutes (per match) | 2.62 | 2.88 | +10% | No (p = 0.32)² |
| Out of possession: low block and pressing | ||||
| % of out-of-possession time defending in a low block | 19.1% | 23.2% | +27% † | Yes |
| Length of the low block (last to first outfield player) | 25.2 m | 22.5 m | −3.4 m † | Yes |
| Height of the back line in the low block (from own goal) | 17.8 m | 18.2 m | +0.75 m † | No³ |
| Pressures per team per 90 minutes | 284 | 255 | −8% † | Yes |
| Average duration of each pressure | 1.48 s | 1.58 s | +6% † | Yes |
| Total seconds spent pressing per team per 90 minutes | 420 | 402 | −2% † | No |
| % of pressures steering the opponent inside | 23.1% | 21.1% | −10% † | Yes |
| Ball recoveries per 100 pressures | 17.4 | 18.3 | +3% † | No |
| Aerial duels won per team per 90 minutes | 17.8 | 14.6 | −18% † | Yes |
| Physical duels won per team per 90 minutes | 2.0 | 1.2 | −45% † | Yes (few cases) |
| In possession | ||||
| Ball progressions (carries) per team per 90 minutes | 20.6 | 25.3 | +20% † | Yes |
| % of in-possession time in counter-attacks | 1.75% | 1.46% | −22% † | Yes |
| Physical and substitutions | ||||
| Total distance per team per 90 minutes | 112.4 km | 111.7 km | 0% † | No |
| Distance above 25 km/h per team per 90 minutes | 2,338 m | 2,068 m | −9% † | Yes⁴ |
| High-speed runs per team per 90 minutes | 1,314 | 1,233 | −5% † | Yes⁴ |
| Change in the same player's intensity from match to match | ≈ 0 | ≈ 0 | — | No (±0.5% per match) |
| % of team-matches using all 5 substitutions (first phase) | 59% | 81% | +22 pp | Yes |
| % of minutes played by the 11 most-used players (5+ matches, excl. 3rd group match) | 82.1% | 83.4% | +1.3 pp | No |
| Goals from outside the box | ||||
| Shots from outside the box per team per 90 minutes | 3.87 | 4.32 | +12% | Yes (p = 0.047) |
| Goals from outside the box per team per 90 minutes | 0.09 | 0.18 | ×2 | Borderline (q ≈ 0.04–0.05) |
| Goals from outside the box per match | 0.19 (1 every 5.3) | 0.37 (1 every 2.7) | ×2 | Borderline |
| Conversion of all shots from outside the box (excl. penalties) | 2.4% | 4.1% | ×1.7 | No (p = 0.10) |
| Conversion of on-target shots from outside the box | 8.7% (12/138) | 16.3% (38/233) | ×1.9 | Yes (p = 0.04) |
| Conversion of on-target shots from inside the box | 40.4% | 37.0% | −3.4 pp | No (p = 0.30) |
| Average distance of shots from outside the box | 24.3 m | 24.3 m | 0 | No |
| Average angle of shots from outside the box | 16.0° | 16.1° | 0 | No |
| % of on-target shots from outside the box within 0.5 m of a post or the crossbar | 22% | 22% | 0 | No |
| Conversion of on-target shots from outside the box more than 0.5 m from a post or the crossbar | 2.9% (3/104) | 12.2% (22/180) | ×4 | Fragile⁵ |
| % of on-target shots from outside the box the goalkeeper saved and held | 46% | 34% | −12 pp | Yes (p = 0.02) |
| % of on-target shots from inside the box the goalkeeper saved and held | 19.2% | 19.3% | 0 | No |
| Most goals from outside the box conceded by a single goalkeeper | 2 | 3 | — | — |
| Different scorers of goals from outside the box | 12 of 12 goals | 33 of 38 goals | — | — |
| Gap between teams and wear | ||||
| % of first-phase matches won by 3 or more goals | 10% | 23% | +13 pp | Borderline (p ≈ 0.05–0.08) |
| Shot share of the dominant team (first phase) | 66% | 66% | 0 | No |
| Possession share of the dominant team (first phase) | 61% | 61% | 0 | No |
| Early substitutions for physical reasons in the last 16 (per press reports) | 2 | 8 | +6 | Not tested (small sample) |
† Change for the 26 national teams that played both World Cups, each compared with itself and adjusted for opponent ranking and tournament phase. In rows without †, the change is the direct difference between the 2022 and 2026 values. The 2022 and 2026 values are averages over all matches.
¹ In Qatar almost every stadium was air-conditioned (taken as 22 °C). In 2026 temperatures ranged from 14 to 39 °C.
² Poisson test: rate ratio 1.10 (95% confidence interval: 0.91 to 1.32).
³ Significant on its own, but not after correcting for the number of metrics compared.
⁴ Controlling for temperature. FIFA does not report whether the calibration of its tracking system changed between tournaments.
⁵ Depends on the threshold: with 0.3 m, 0.75 m or 1 m the difference is no longer significant.